
![[Open Data]](https://assets.okfn.org/images/ok_buttons/od_80x15_blue.png)
Anode activity in high current vacuum arcs leads to the formation of various high current modes and transitions between them. Intense material evaporation during the anode spot mode and formation of a neutral vapour cloud during the anode plume mode modify the arc plasma properties and, hence, can have a crucial impact in applications, like e.g. reduction of interruption performance of switching devices. The influence of anode mode appearance on arc plasma parameters and on anode surface temperature was studied in detail by a novel optical diagnostic technique—intensified video optical emission spectroscopy. Employing advanced diagnostic methods, the ground state density, excitation temperature and pressure profiles close to the anode surface have been determined. For the anode plume mode, higher copper vapour pressure was found in the plume shell compared to its core. The copper ion density distribution shows a maximum outside of the plume shell. Consequently, a higher electrical conductivity in the surrounding area of the plume might be expected, i.e. the arc current flows around the plume rather than through it. Analysis of the temporal evolution of electrical and optical signals reveals that voltage jumps and drops during the mode transitions are accompanied by noticeable changes in the anode surface temperature. Thus, the formation of the anode plume leads to temperature lowering while the transition to the anode spot mode is accompanied by a temperature increase. In general, a clear correlation between electrode surface temperature and arc voltage in the case of constricted anode attachment is found. The results of this study give new insights into anode plume properties and consequences of anode mode transitions. Reversible mode transitions and correlations between arc voltage and anode surface temperature, as well as changes in the current path during anode plume mode, have to be considered as factors for optimization of electrode design and choice of materials for switching applications.
| Field | Value |
|---|---|
| Group | |
| Authors | |
| Release Date | 2025-09-16 |
| Identifier | 3430ff37-1c98-4482-a8a5-8d04aea4c924 |
| Permanent Identifier (DOI) | |
| Permanent Identifier (URI) | |
| Is supplementing | |
| Plasma Source Name | |
| Plasma Source Application | |
| Plasma Source Specification | |
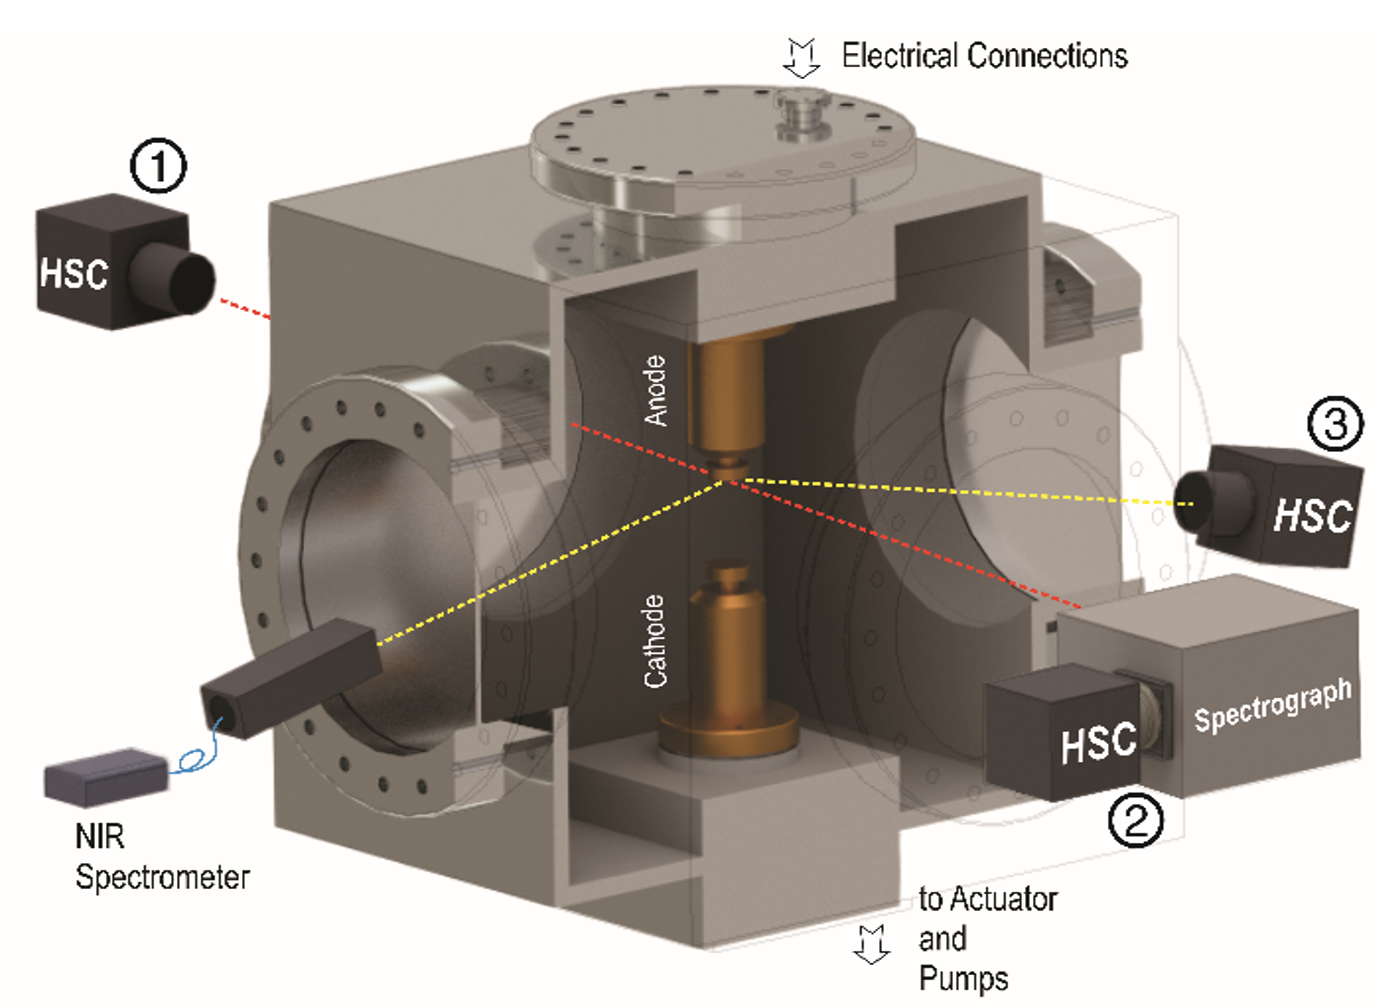
| Plasma Source Properties | Model vacuum circuit breaker with a contact system in a vacuum chamber with optical access (four glass windows), with a pneumatic drive to move the lower electrode (grounded cathode) with an averaged velocity of 1.25 m/s, with a pumping system (roughing pump and turbomolecular pump) to evacuate the chamber down to 10^-7 mbar pressure, and with an AC pulse current source based on a capacitor bank. The fixed anode and the movable cathode are disc-shaped electrodes of CuCr (60/40) with a diameter of 30 mm. |
| Plasma Source Procedure | The vacuum arc is ignited by contact separation. 50 Hz sinosoidal currents with peak values from 1 to 7.5 kA have been studied. |
| Plasma Medium Name | |
| Plasma Medium Properties | Cu-Cr metal vapour from electrode erosion with time dependent and inhonogeneous distribution strongly dependent on the cathode and anode evaporation by cathode and anode spots. |
| Plasma Target Name | |
| Plasma Target Properties | No target (electrodes can be considered as the target) |
| Plasma Diagnostics Name | |
| Plasma Diagnostics Properties | Electric measurements: High-speed imaging of the arc: Optical emission spectroscopy (OES) of the arc: Measurement of anode surface temperature: |
| Plasma Diagnostics Procedure | Optical emission spectroscopy (OES) of the arc: Measurement of anode surface temperature: |
| Language | English |
| License | |
| Public Access Level | Public |
| Contact Name | Uhrlandt, Dirk |
| Contact Email |
Data and Resources
- Advanced temporal analysis of anode activity during mode transitions - Figure 1png
Schematic view of the model vacuum circuit breaker with the positions of...
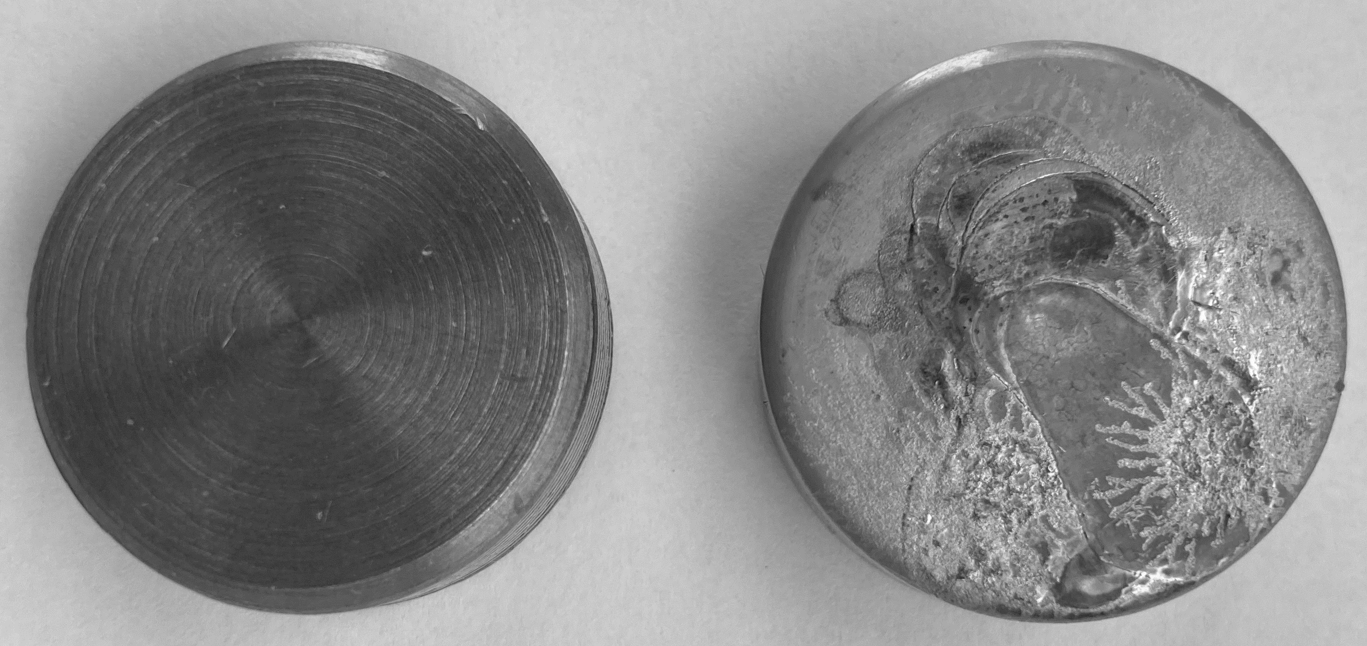
Download - Advanced temporal analysis of anode activity during mode transitions - Figure 2png
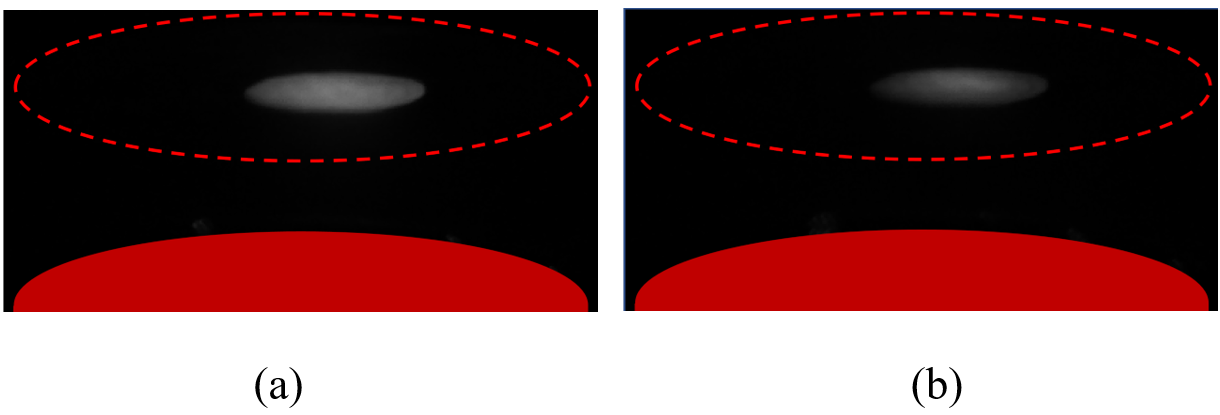
Images of CuCr electrodes used in present study. Left - fresh electrode,...
Download - Advanced temporal analysis of anode activity during mode transitions - Figure 3csv
Current and voltage waveforms with corresponding electrode displacement for...
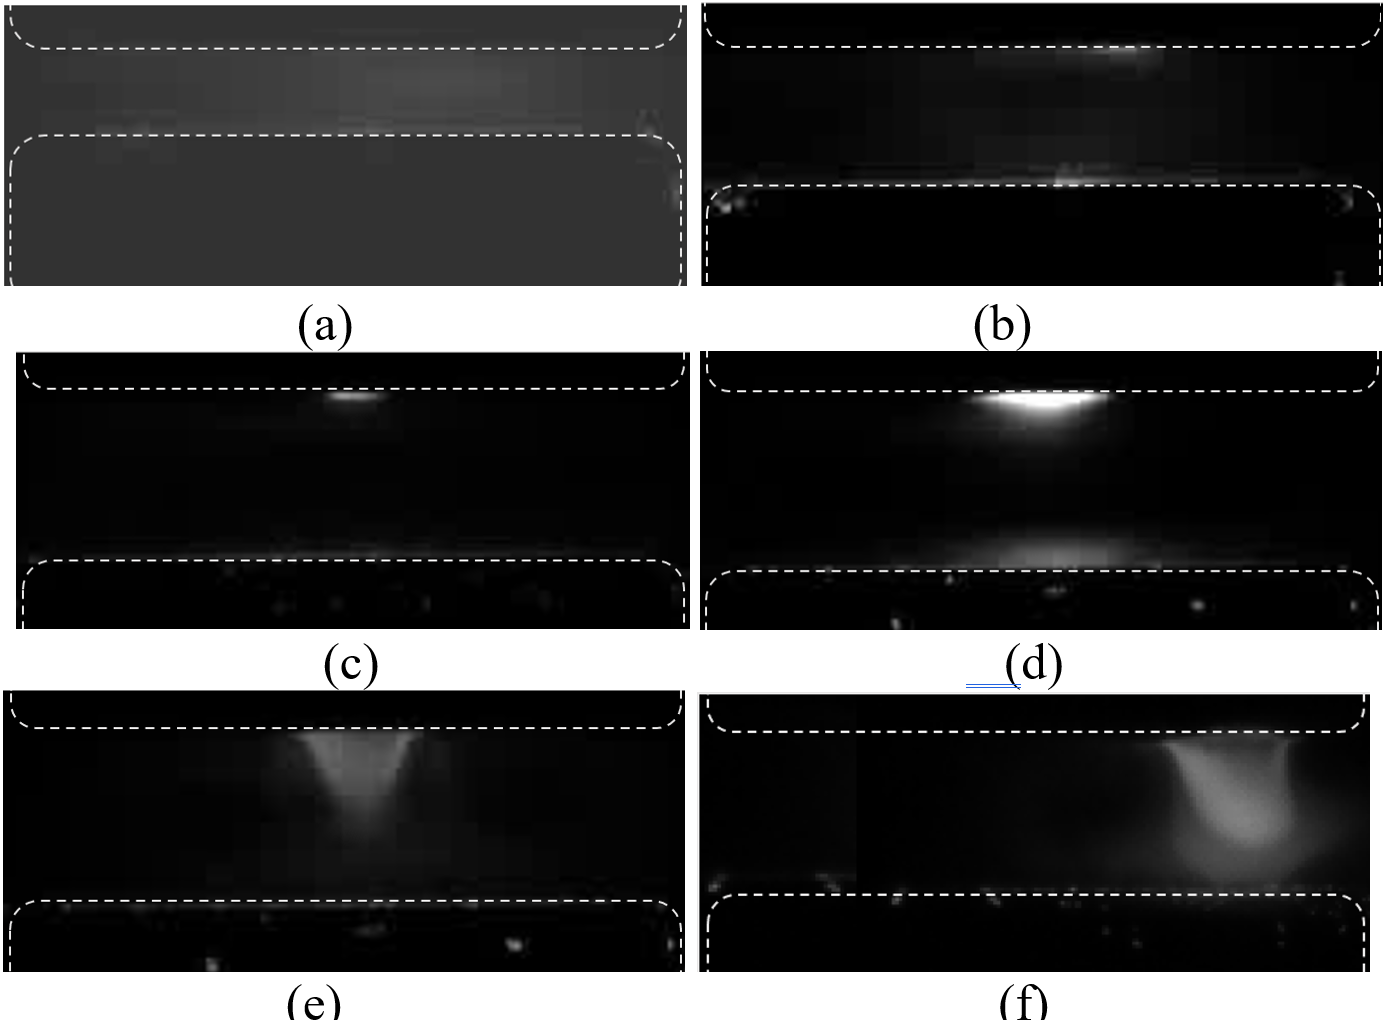
Preview Download - Advanced temporal analysis of anode activity during mode transitions - Figure 4png
Images of the arc for peak current 4.7 kA, arc duration 9.2 ms, with various...
Download - Advanced temporal analysis of anode activity during mode transitions - Figure 4 (supplement video)mp4
Example of vacuum arc videos with HSC 1 for peak current 4.7 kA, arc...
Download - Advanced temporal analysis of anode activity during mode transitions - Figure 5csv
Transition between different vacuum arc modes along the function of the...
Preview Download - Advanced temporal analysis of anode activity during mode transitions - Figure 6acsv
Influence of peak current on formation of high current anode modes - instant...
Preview Download - Advanced temporal analysis of anode activity during mode transitions - Figure 6bcsv
Influence of peak current on formation of high current anode modes - total...
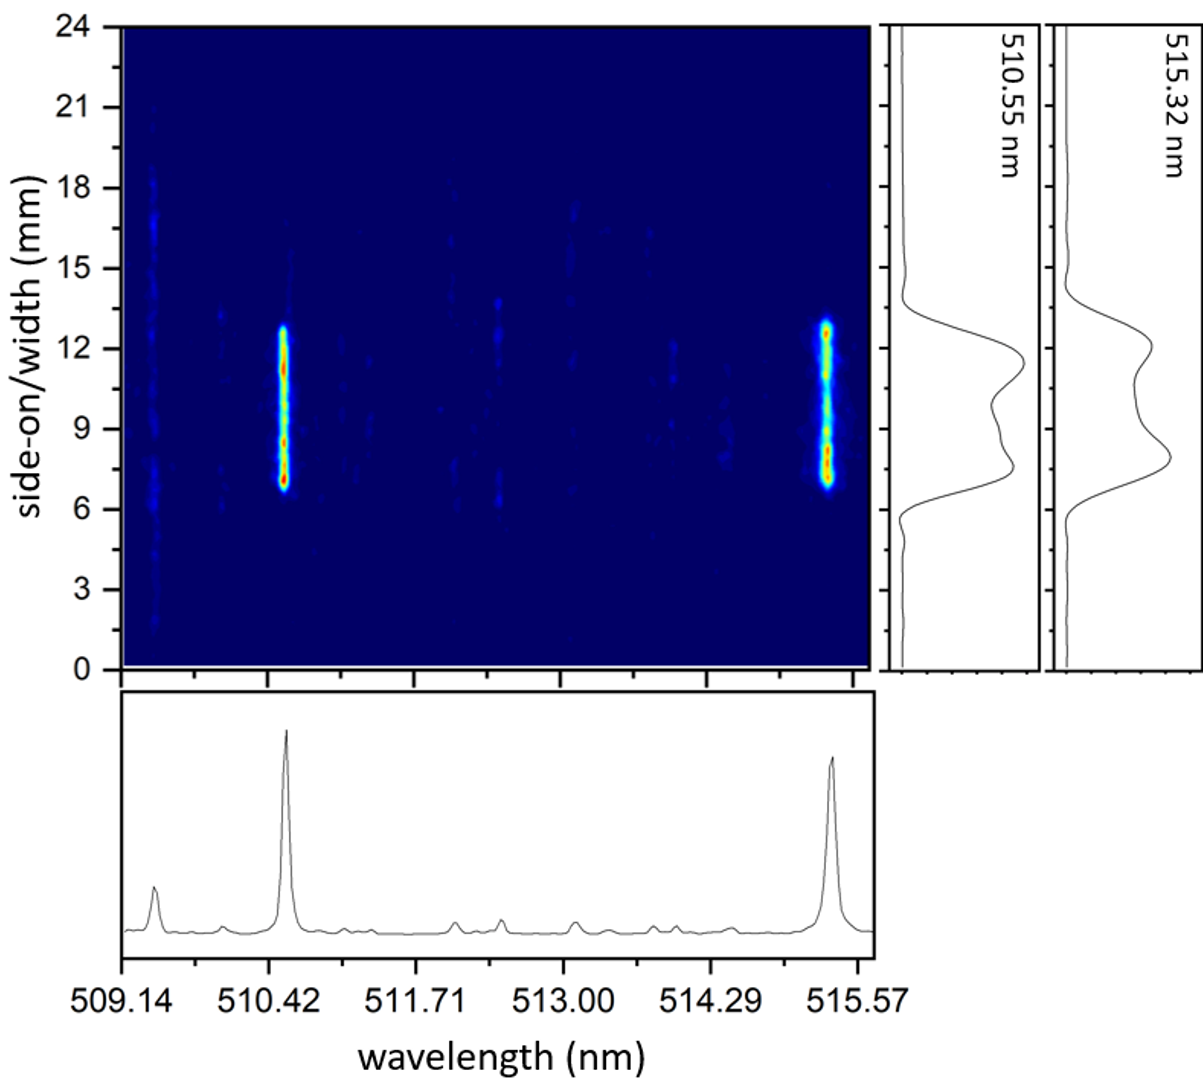
Preview Download - Advanced temporal analysis of anode activity during mode transitions - Figure 7png
Example of spectrum recorded by HSC 1 at the instant of a plume formation –...
Download - Advanced temporal analysis of anode activity during mode transitions - Figure 8png
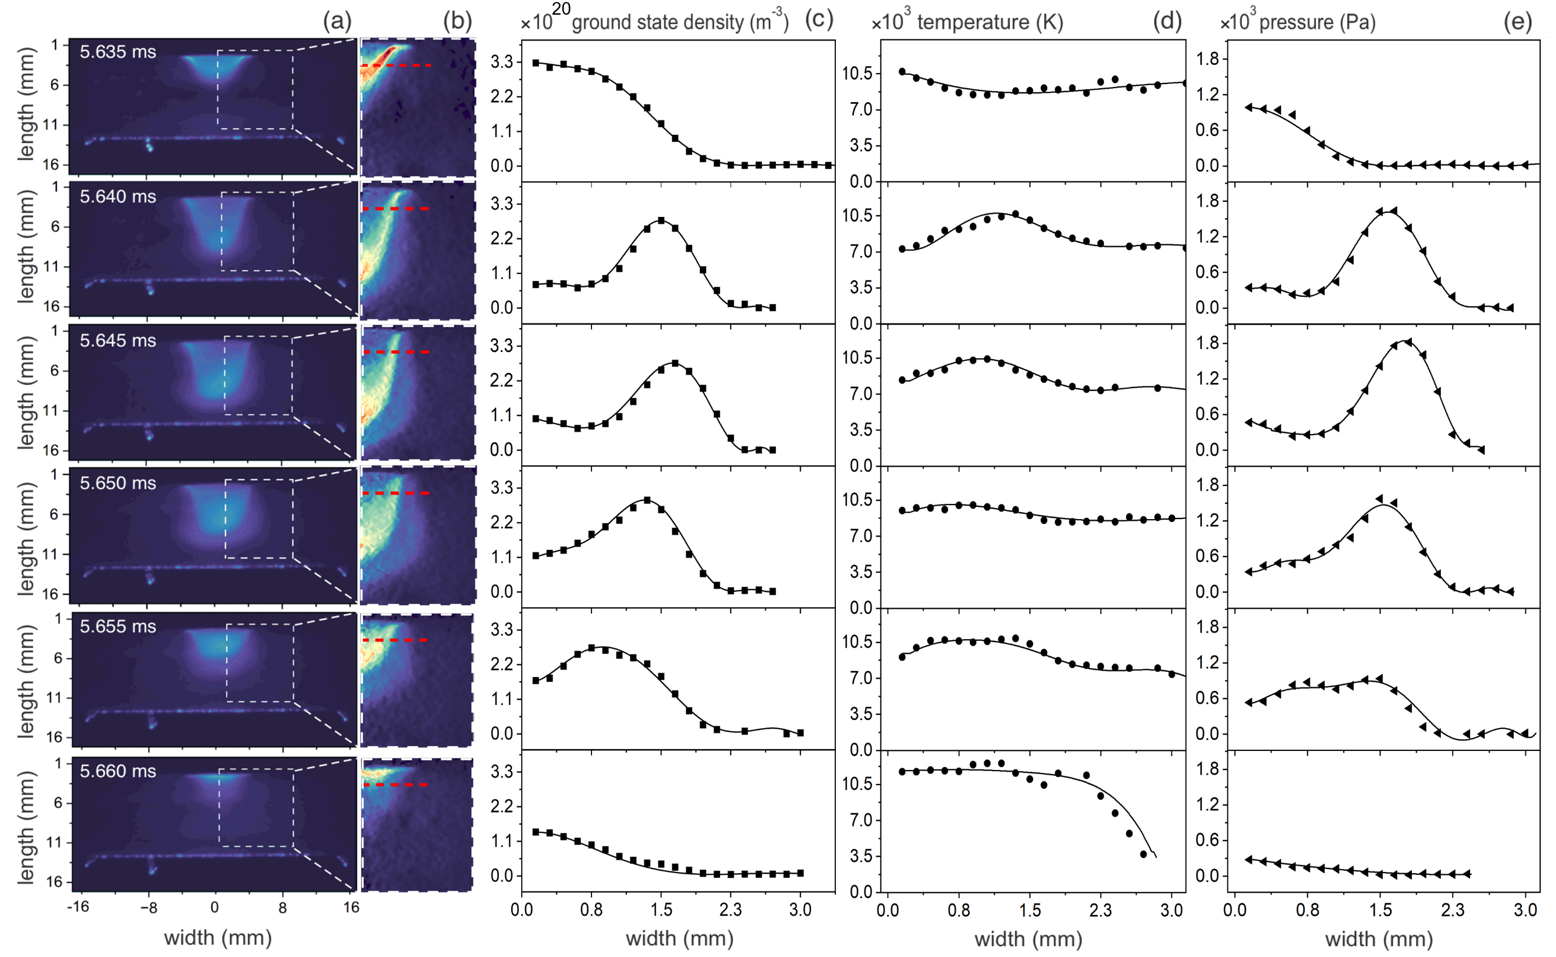
Arc images acquired during the anode plume formation with HSC 1 and...
Download - Advanced temporal analysis of anode activity during mode transitions - Figure 9png
Images of anode surface radiation filtered by MIF (central wavelength 891 nm...
Download - Advanced temporal analysis of anode activity during mode transitions - Figure 10png
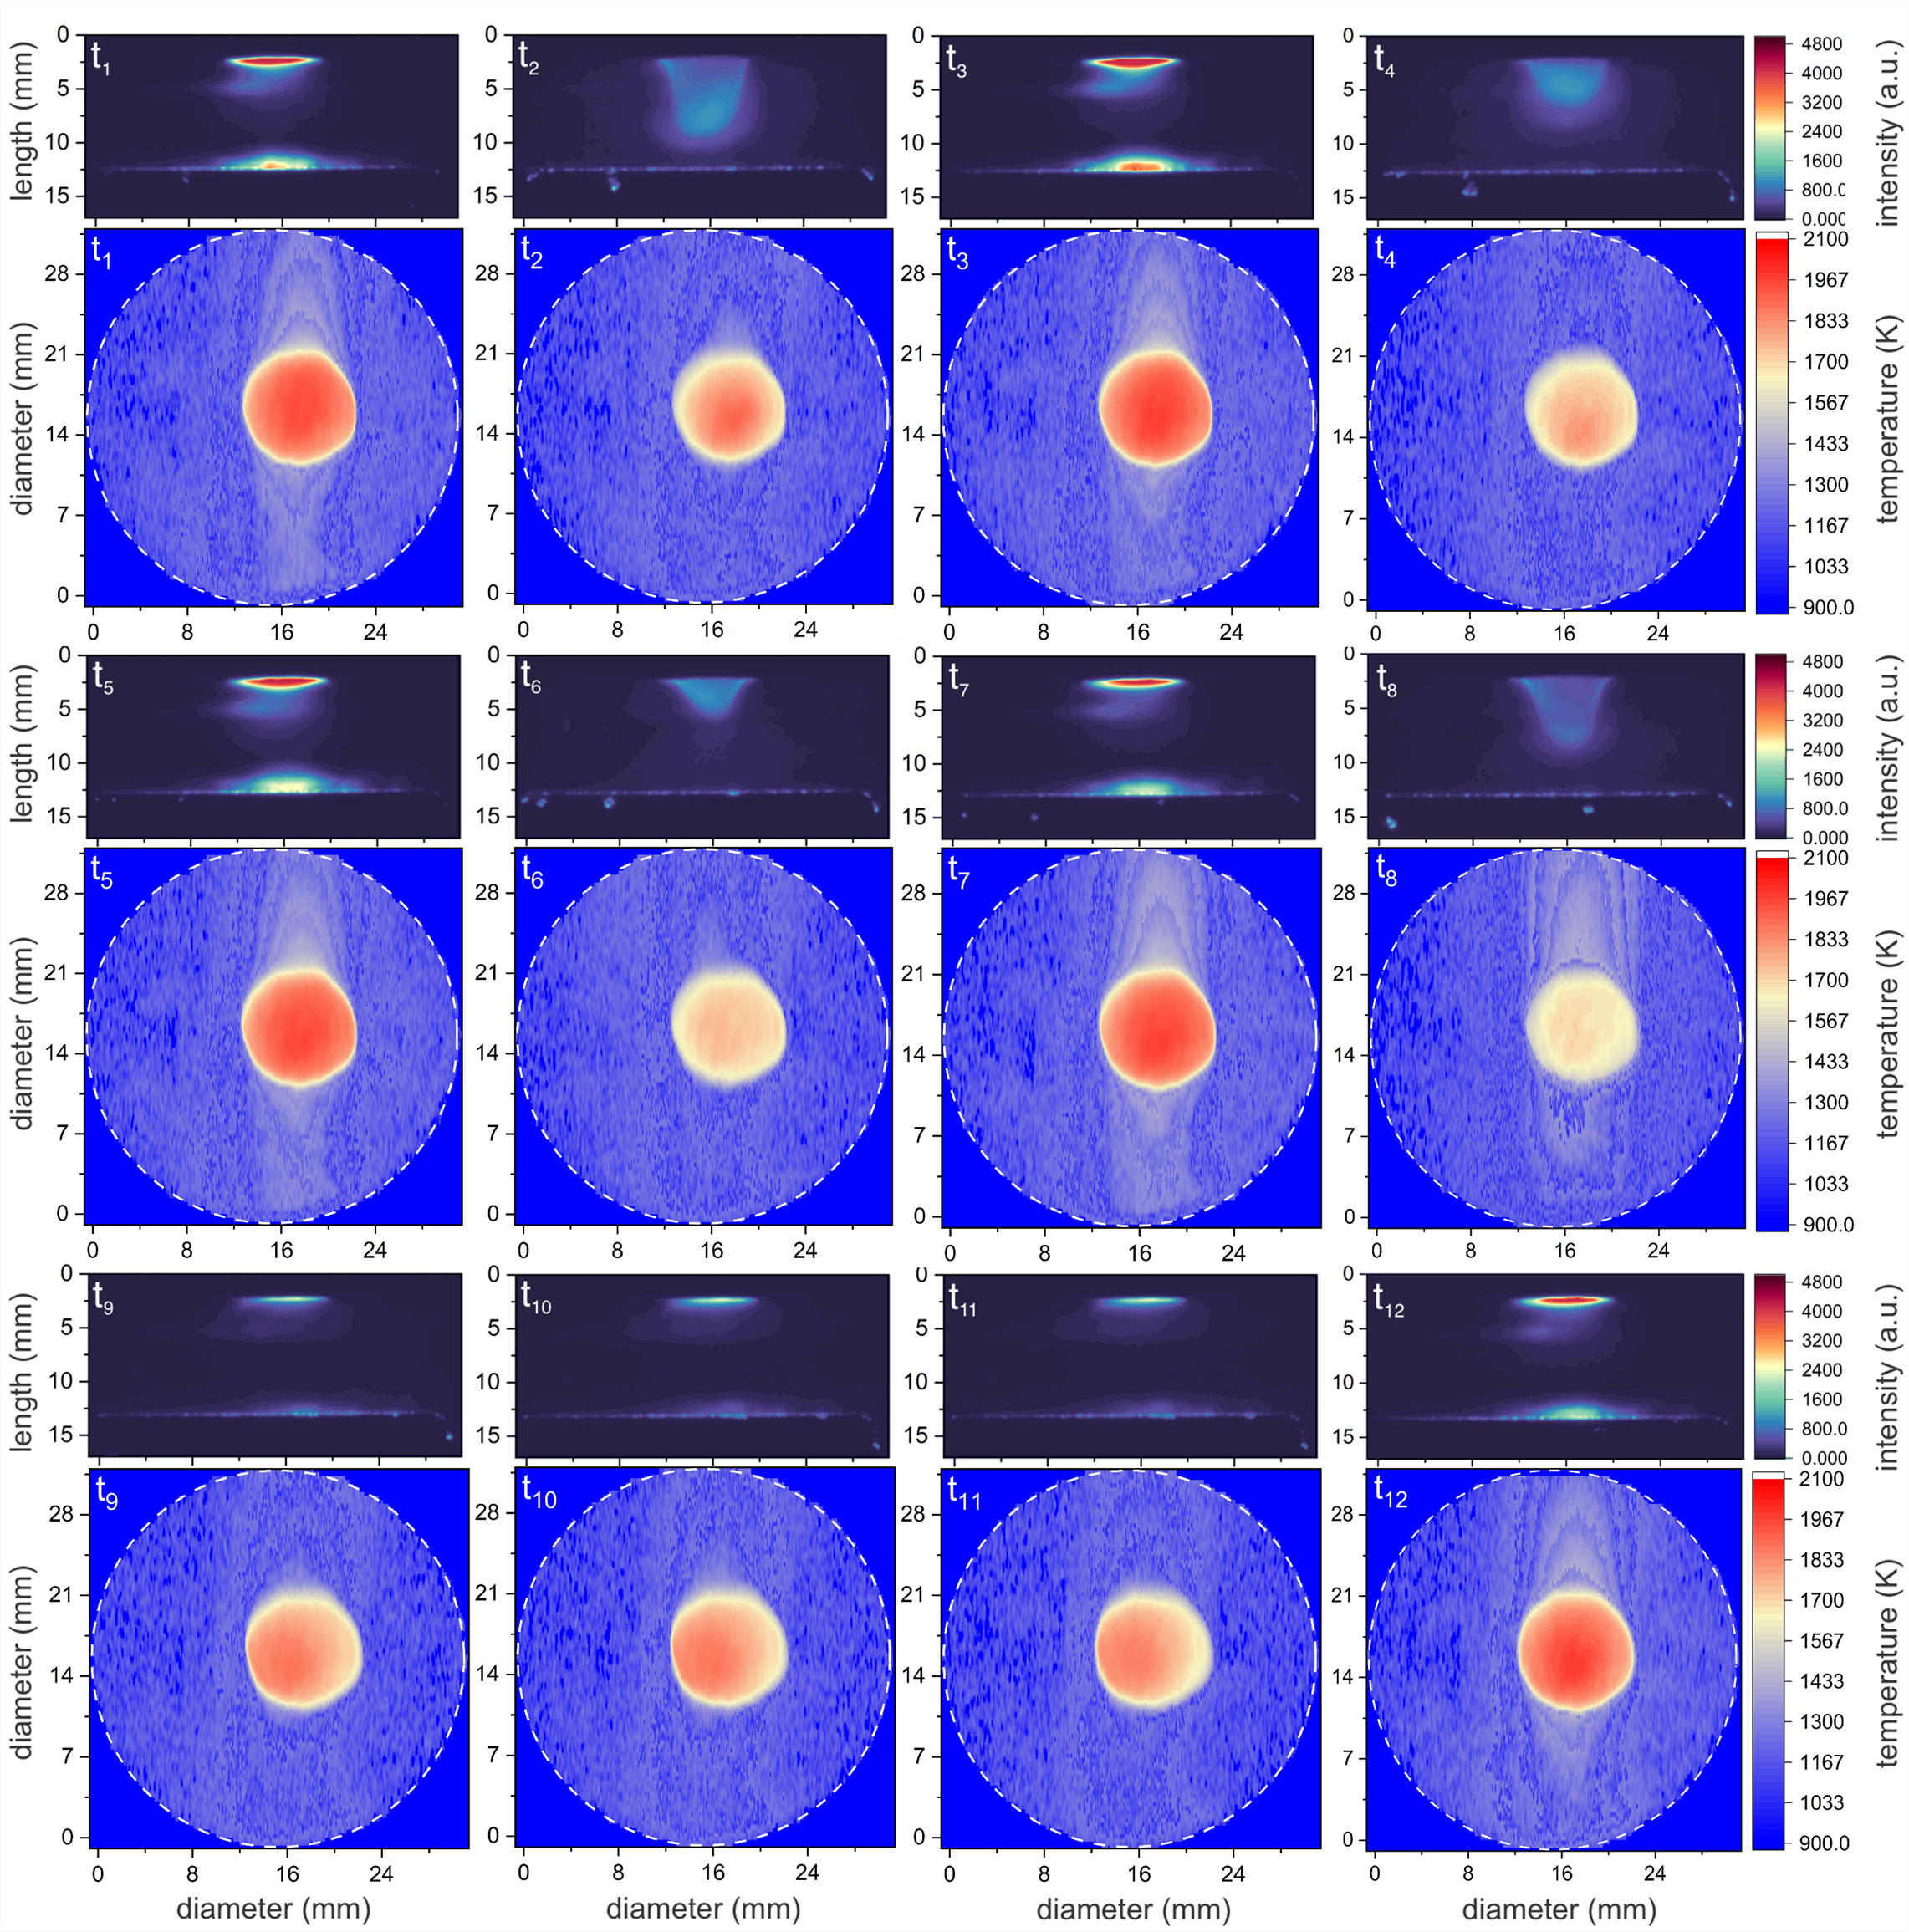
Anode surface temperature (K) at the instants t1−t12 (given in Figure 11,...
Download - Advanced temporal analysis of anode activity during mode transitions - Figure 11csv
Maximum anode surface temperature and arc current at the instants t1−t12....
Preview Download - Advanced temporal analysis of anode activity during mode transitions - Figure 12csv
Observed plume length along with current and voltage in the time segment of...
Preview Download - Advanced temporal analysis of anode activity during mode transitions - Figure 13acsv
Correlation between arc voltage and maximum anode surface temperature for...
Preview Download - Advanced temporal analysis of anode activity during mode transitions - Figure 13bcsv
Correlation between arc voltage and maximum anode surface temperature for...
Preview Download - Advanced temporal analysis of anode activity during mode transitions - Figure 13ccsv
Correlation between arc voltage and maximum anode surface temperature for...
Preview Download - Advanced temporal analysis of anode activity during mode transitions - Figure 13dcsv
Correlation between arc voltage and maximum anode surface temperature for...
Preview Download